Use Layout object with grid graphics.
lay_grid(grobs, lay, ...)

layGrid(grobs, lay, ...)
Arguments
- grobs
list of grobs.
- lay
a Layout object.
- ...
other parameters passed to
grid.arrange.
Value
gtable object containing multiple graphs. See grid.arrange.
Examples
library(ggplot2)
l1 <- lay_new(matrix(1:2, ncol = 1), heights = c(2, 3))
l2 <- lay_new(matrix(1:2, ncol = 1), heights = c(1, 3))
l3 <- lay_bind_col(l1, l2)
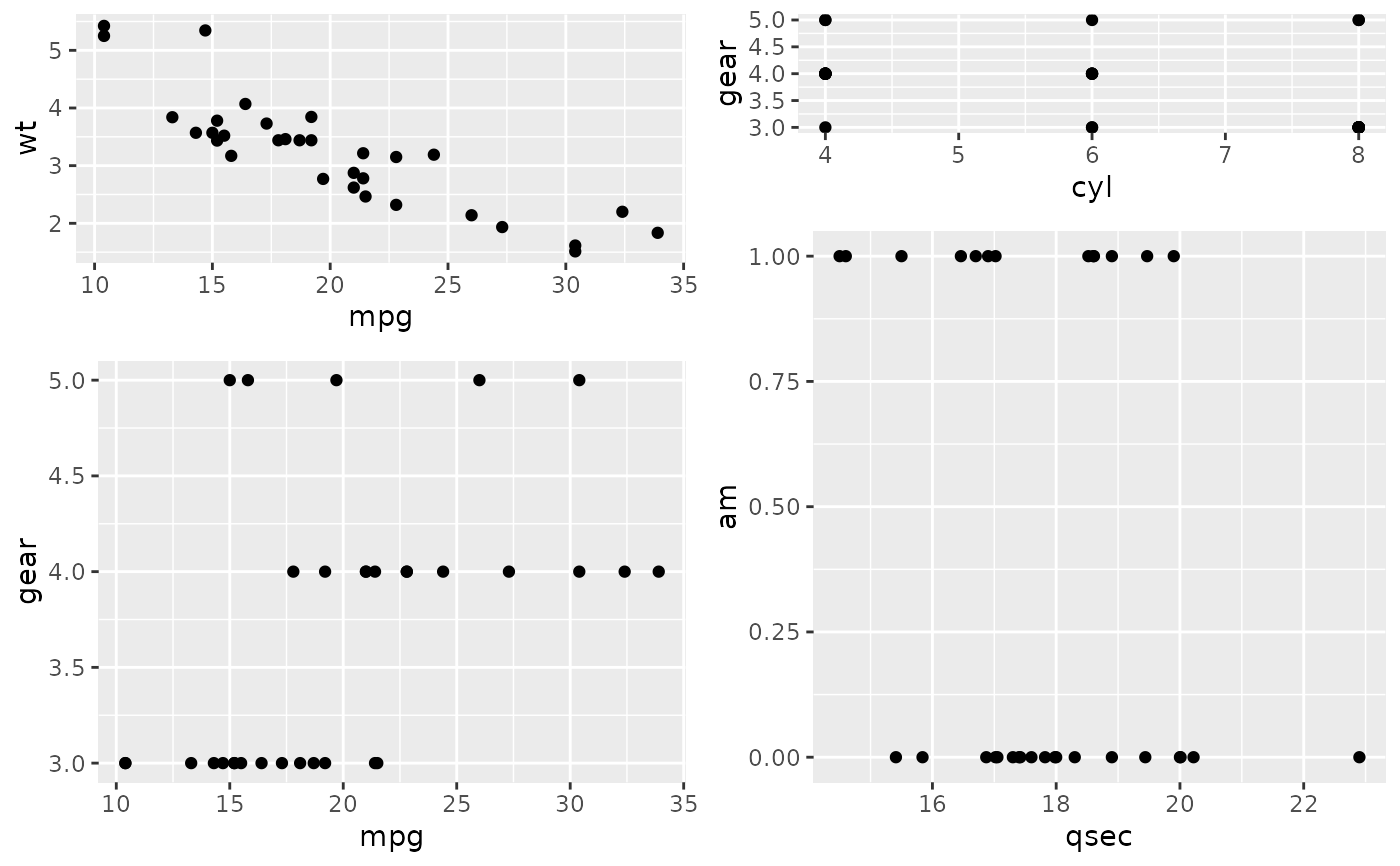
pl1 <- qplot(mpg, wt, data = mtcars)
#> Warning: `qplot()` was deprecated in ggplot2 3.4.0.
pl2 <- qplot(mpg, gear, data = mtcars)
pl3 <- qplot(cyl, gear, data = mtcars)
pl4 <- qplot(qsec, am, data = mtcars)
lay_grid(list(pl1, pl2, pl3, pl4), l3)