Create custom layout.
lay_new(mat, widths = NULL, heights = NULL)

layCreate(mat, widths = NULL, heights = NULL)
Arguments
- mat
a matrix specifying the location of the figures. See
layoutfor more information.- widths
a vector of values for the relative heights of rows in mat.
- heights
a vector of values for the relative heights of rows in mat.
Value
CustomLayout object.
Details
This function creates a new CustomLayout object which contains the information about all the fields and their relative sizes.
By combining multiple CustomLayout objects you can create more complicated layouts for your plots.
This object is an alternative to layout function.
See also
Examples
library(customLayout)
set.seed(123)
oldpar <- par(mar = c(3, 2, 2, 1))
# Prepare layout
lay <- lay_new(matrix(1:4, nc = 2),
widths = c(3, 2),
heights = c(2, 1))
lay2 <- lay_new(matrix(1:3))
cl <- lay_bind_col(lay, lay2, widths = c(3, 1))
lay_set(cl) # initialize drawing area
# add plots
plot(1:100 + rnorm(100))
plot(rnorm(100), type = "l")
hist(rnorm(500))
acf(rnorm(100))
pie(c(3, 4, 6), col = 2:4)
pie(c(3, 2, 7), col = 2:4 + 3)
pie(c(5, 4, 2), col = 2:4 + 6)
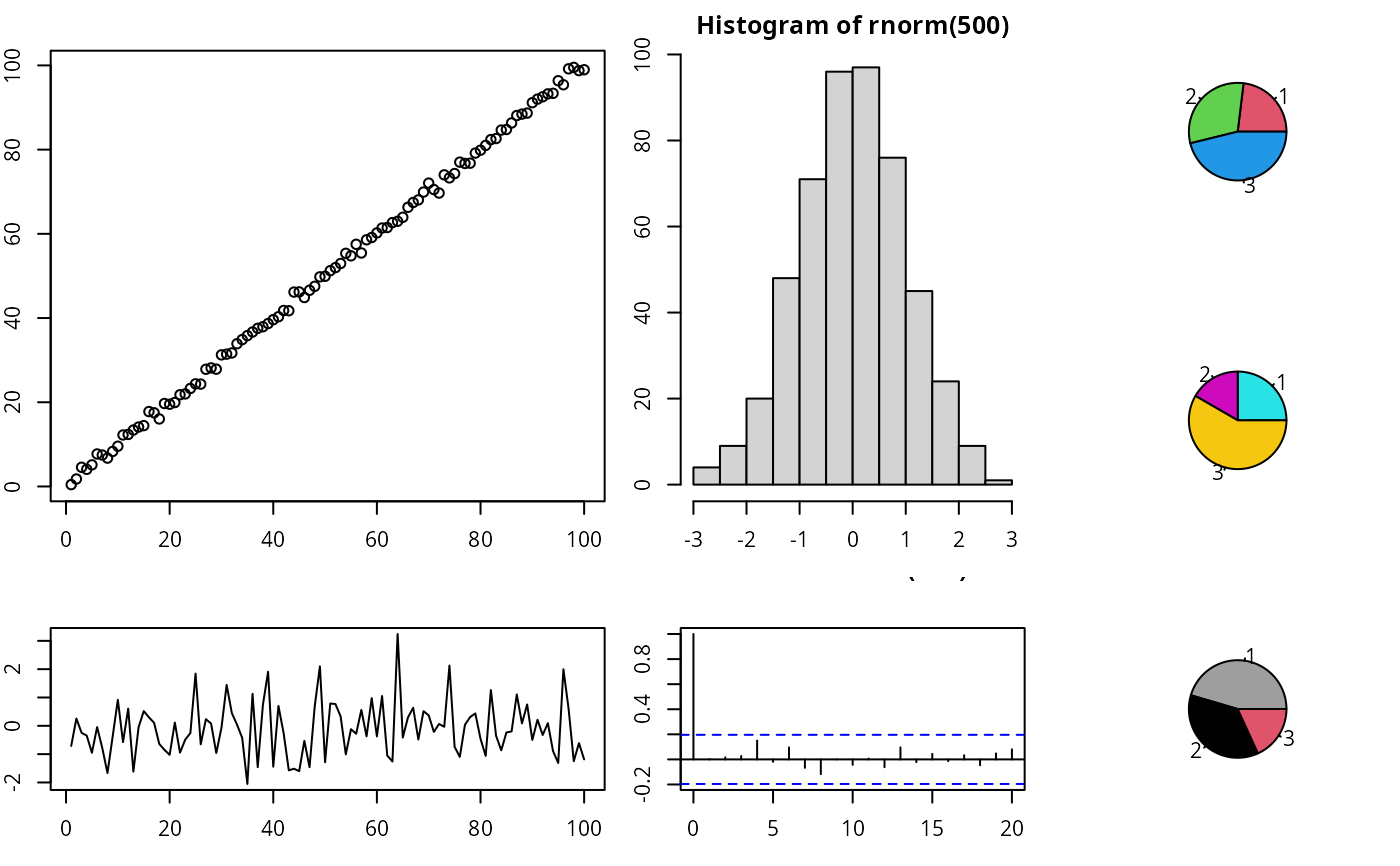 par(oldpar)