Layouts for officer’s PowerPoint documents.
Zygmunt Zawadzki
2021-01-13
Source:vignettes/layouts-for-officer-power-point-document.Rmd
layouts-for-officer-power-point-document.RmdIntroduction
This document shows how to work with PowerPoint files in R using customLayout approach.
Let’s start by creating a layout. lay and lay2 will be used to store the content of the slide (plots, tables, text), and titleLay will serve as a container for the title of the slide.
It seems that merging the title placeholder in the last step allows to the easy control its ratio to the content of the slide. Note that titleLay is merged with lay3 (combination of lay and lay2) using a ratio 1:7, so the content of the slide will occupy about 87,5% of the area (7/(1+7)).
library(customLayout)
library(officer)
library(magrittr)
library(ggplot2)

lay  <- lay_new(matrix(1:4,nc=2),widths=c(3,2),heights=c(2,1))
lay2 <- lay_new(matrix(1:3))
titleLay <- lay_new(1, widths = 1, heights = 1)

lay3   <- lay_bind_col(lay,lay2, widths=c(3,1))
layout <- lay_bind_row(titleLay, lay3, heights = c(1,7))

lay_show(layout)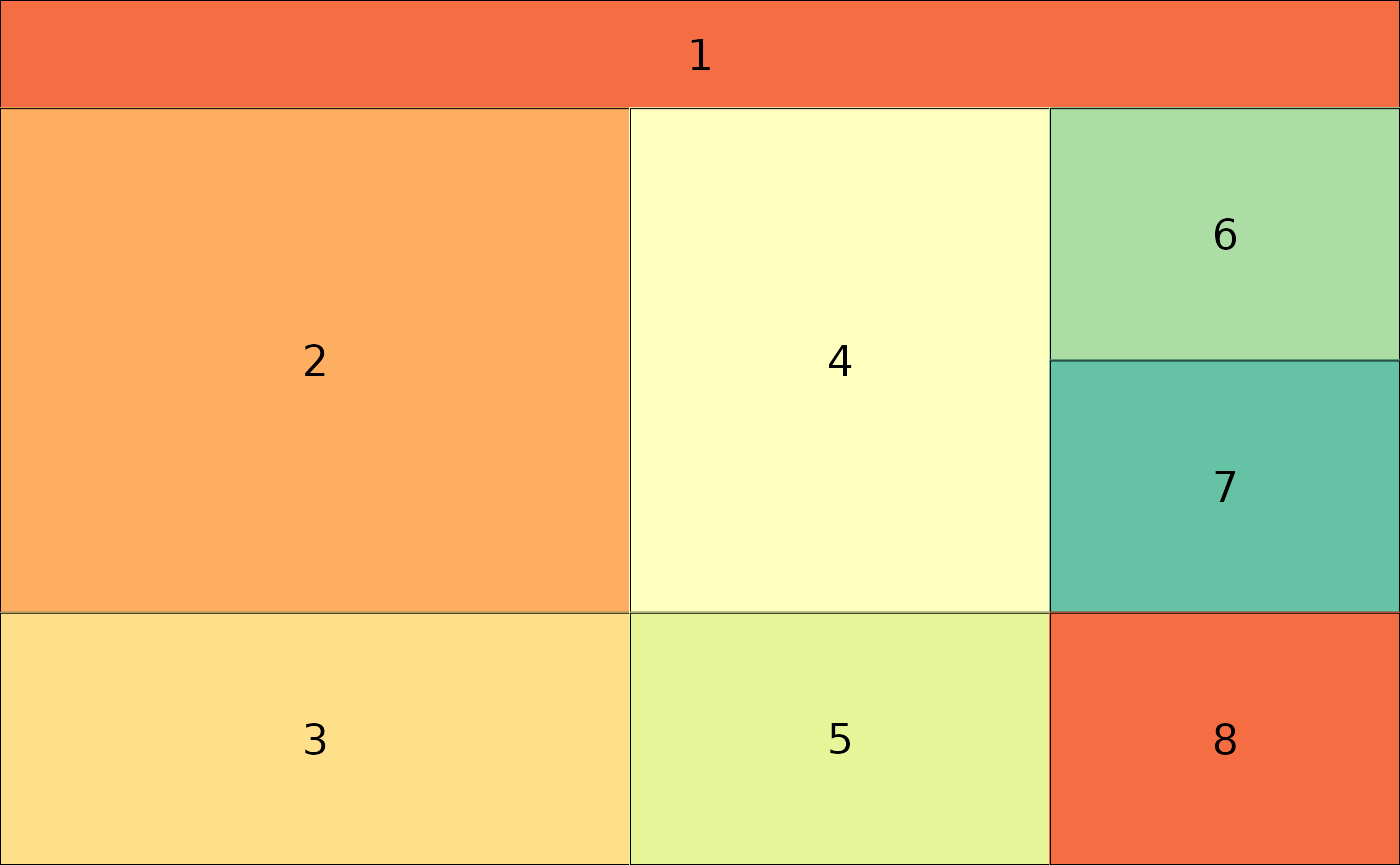
In the next step, one needs to create an officer layout from an existing layout object. It is done by calling phl_layout, which allows specifying the target size of the slide and margins.
## create officer layout
offLayout <- phl_layout(layout,
    margins = c(0.25, 0.25, 0.25, 0.25),
    innerMargins = rep(0.15,4))
ggplot2
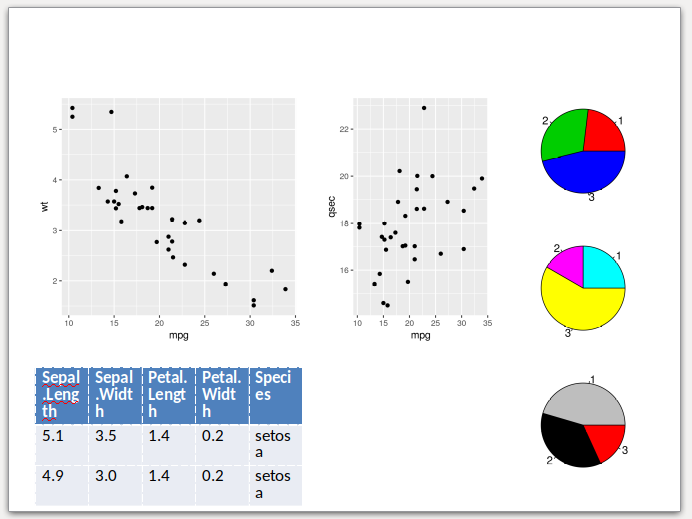
Then, the elements of the slide are added using functions with phl_* prefix. The code below adds two ggplot plots into the slide using phl_with_gg.
pptx <- read_pptx() %>%
  add_slide(master = "Office Theme", layout = "Title and Content")

### fill first placeholder

plot1 <- qplot(mpg, wt, data = mtcars)
plot3 <- qplot(mpg, qsec, data = mtcars)
pptx <- phl_with_gg(pptx, offLayout, 2, plot1)
pptx <- phl_with_gg(pptx, offLayout, 4, plot3)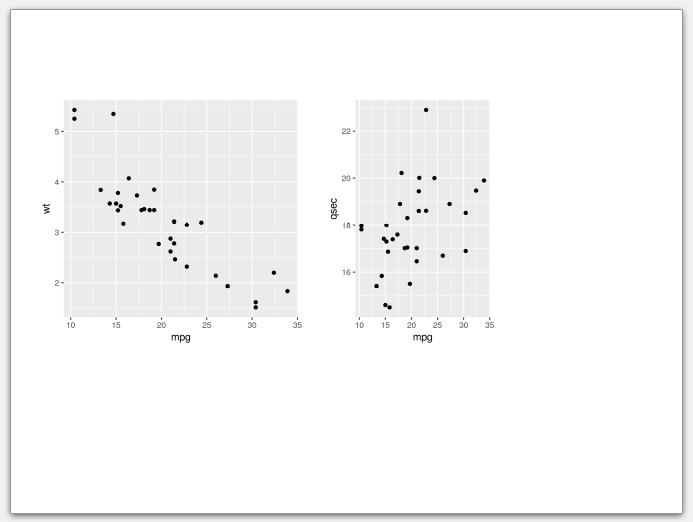
Base graphics
It is also worth to note that pptx files allow intermixing base graphics with grid graphics (ggplot2 and friends). The example below adds a few pie charts (note from the author - I’m not a fan of pie charts. Please don’t use them on real slides). In this case phl_with_plot requires a function which creates a plot.
pl5 <- function() {
  par(mar = rep(0.1, 4))
  pie(c(3, 4, 6), col = 2:4)
}
pl6 <- function() {
  par(mar = rep(0.1, 4))
  pie(c(3, 2, 7), col = 2:4 + 3)
}
pl7 <- function() {
  par(mar = rep(0.1, 4))
  pie(c(5, 4, 2), col = 2:4 + 6)
}

pptx <- phl_with_plot(pptx, offLayout, 6, pl5)
pptx <- phl_with_plot(pptx, offLayout, 7, pl6)
pptx <- phl_with_plot(pptx, offLayout, 8, pl7)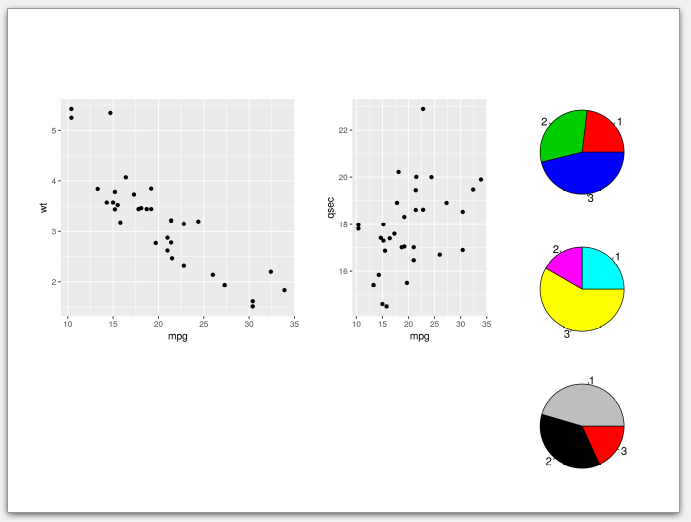
Basic tables
To export data.frame to the slide, one needs to use phl_with_table.
pptx <- phl_with_table(pptx, offLayout, 3, head(iris, 2))Note, that in the current version customLayout is not able to fit the table perfectly to your slide. The desired width will be matched at the expense of the table height and text-wrapping. See the output slide created from the code above. As you can see, the table is a bit too tall, and the texts in cells are inelegantly wrapped.
Text
Inserting the text works in a very similar fashion to the officer package, just use the phl_with_text function. To add the formatting to the text use the style argument as in the example below (phl_with_text internally uses officer::ph_add_text).
pptx <- phl_with_text(pptx, offLayout, 1, "Custom Layout")

style <- fp_text(font.size = 24, color = "red")
pptx  <- phl_with_text(pptx, offLayout, 5,
          "Lorem ipsum", type = "body", style = style)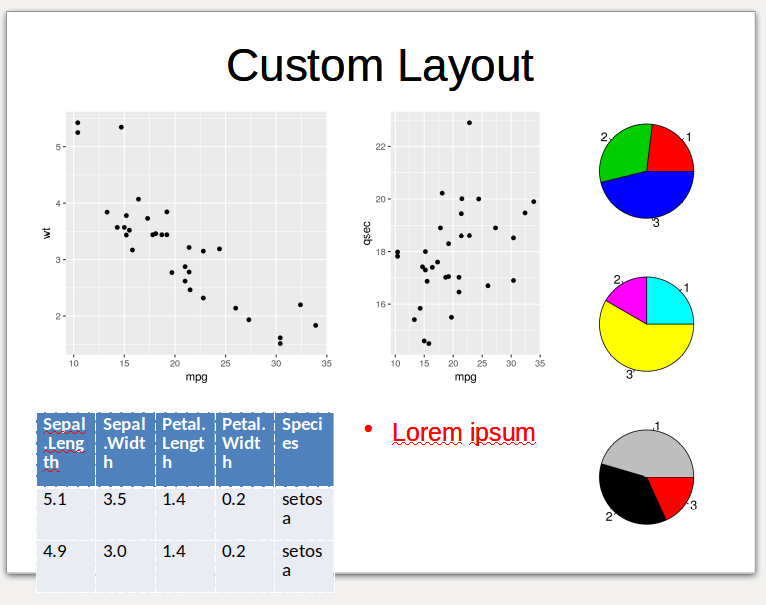
flextables
Getting started
To get more control over created tables, one can use the flextable package (https://davidgohel.github.io/flextable/index.html), which is also supported by the customLayout by the phl_with_flextable function.
Let’s start with preparing the layout and sample data.frame for further examples:
library(customLayout)
library(flextable)
library(dplyr)
#>
#> Attaching package: 'dplyr'
#> The following objects are masked from 'package:stats':
#>
#>     filter, lag
#> The following objects are masked from 'package:base':
#>
#>     intersect, setdiff, setequal, union
library(officer)

lay  <- lay_new(matrix(1:4,nc=2),widths=c(3,2),heights=c(2,1))
lay2 <- lay_new(matrix(1:3))
layout   <- lay_bind_col(lay,lay2, widths=c(3,1))
lay_show(layout)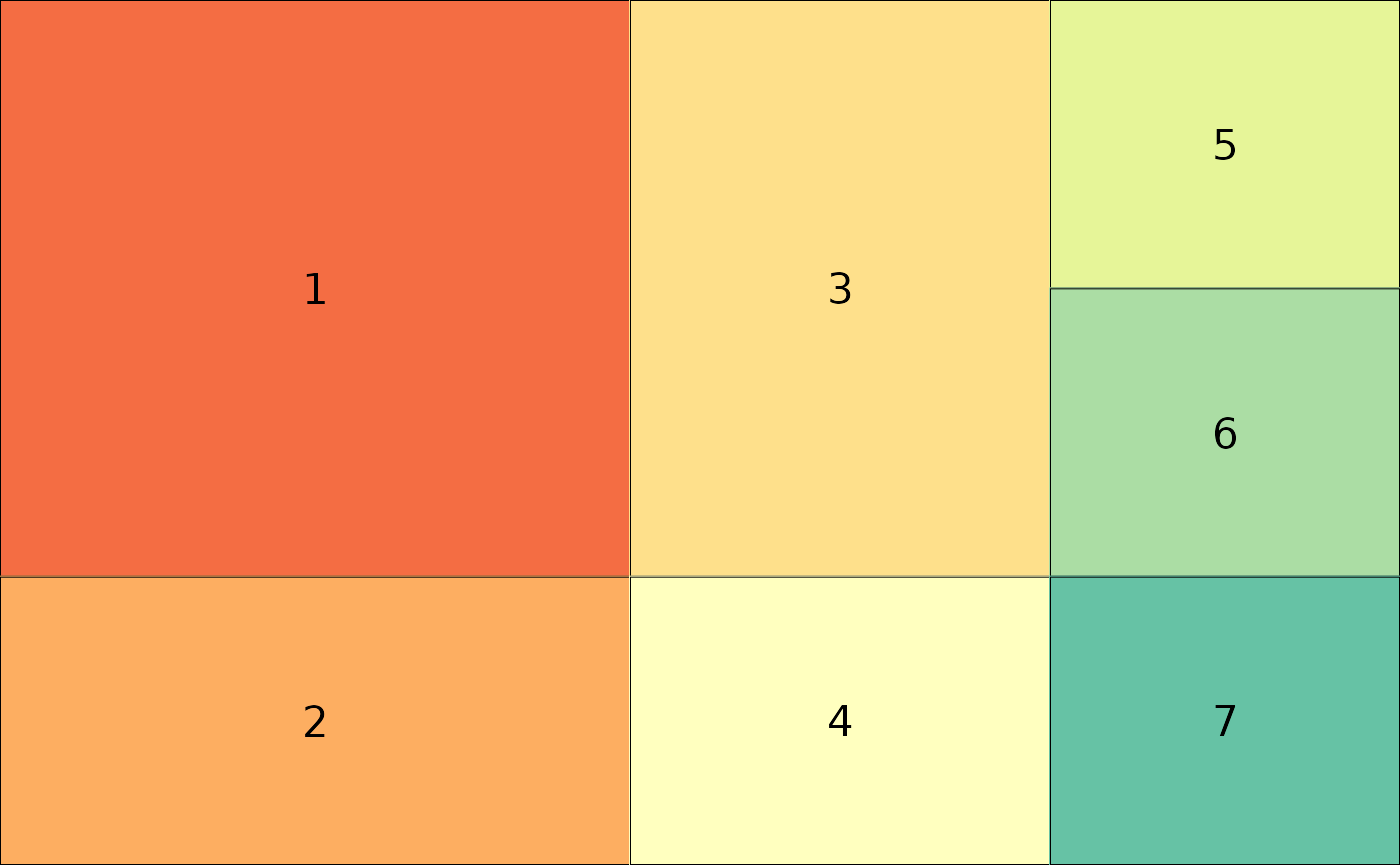
offLayout <- phl_layout(layout,
    margins = c(0.25, 0.25, 0.25, 0.25),
    innerMargins = rep(0.15,4))

pptx <- read_pptx() %>%
  add_slide(master = "Office Theme", layout = "Title and Content")

table <- mtcars %>%
  group_by(cyl) %>%
  summarise(Mean =round(mean(qsec), 2))
#> `summarise()` ungrouping output (override with `.groups` argument)
Simple flextable
To add the flextable to the slide, one needs to convert the data. frame to the flextable object. Then the function phl_with_flextable can be used:
pptx <- read_pptx() %>%
  add_slide(
    master = "Office Theme",
    layout = "Title and Content")

flTableRaw <- flextable(table)
pptx <- phl_with_flextable(pptx,
      olay = offLayout, 1, flTableRaw)
Fit the table to the placeholder
However, the phl_with_flextable does not modify any parameters of the table and writes it to the pptx as is. It means that the user needs to specify the correct font size, the widths, and heights for columns and rows. It might be quite hard to do, but the customLayout provides the phl_adjust_table function which takes a data.frame as an argument and tries to find as large font size, widths and heights as possible for given placeholder in the layout. Note that this function uses some simple heuristics, and might not always work as expected, and some manual tuning will be required.
pptx <- read_pptx() %>%
  add_slide(
    master = "Office Theme",
    layout = "Title and Content")

flTable <- phl_adjust_table(table, olay = offLayout, id = 1)
pptx <- phl_with_flextable(pptx,
      olay = offLayout, 1, flTable)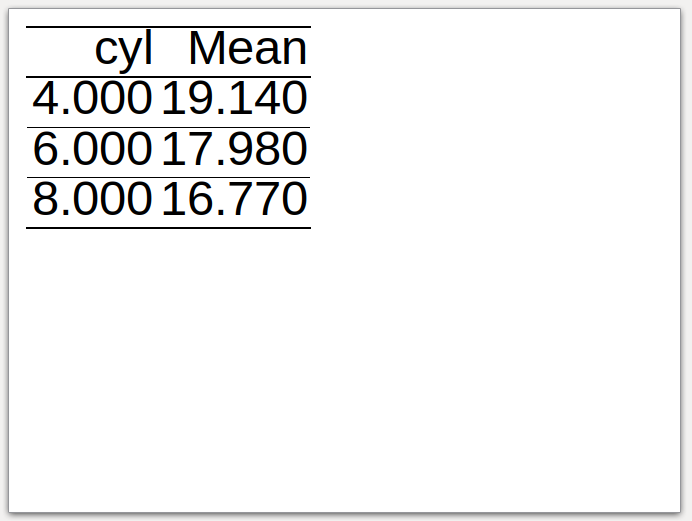
Formatted flextable
After calling the phl_adjust_table one can modify the table in any way. Go to the https://davidgohel.github.io/flextable/articles/overview.html for more examples.
pptx <- read_pptx() %>%
  add_slide(
    master = "Office Theme",
    layout = "Title and Content")

flTable <- phl_adjust_table(table, olay = offLayout, id = 1)

flTable <-  bg(flTable, bg = "#E4C994", part = "header")
flTable <-  bg(flTable, bg = "#333333", part = "body")
flTable <- color(flTable, color = "#E4C994")

pptx <- phl_with_flextable(pptx,
      olay = offLayout, 1, flTable)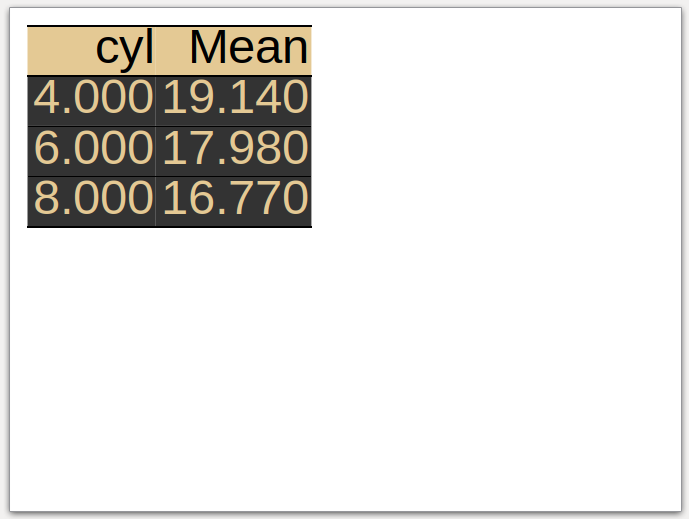
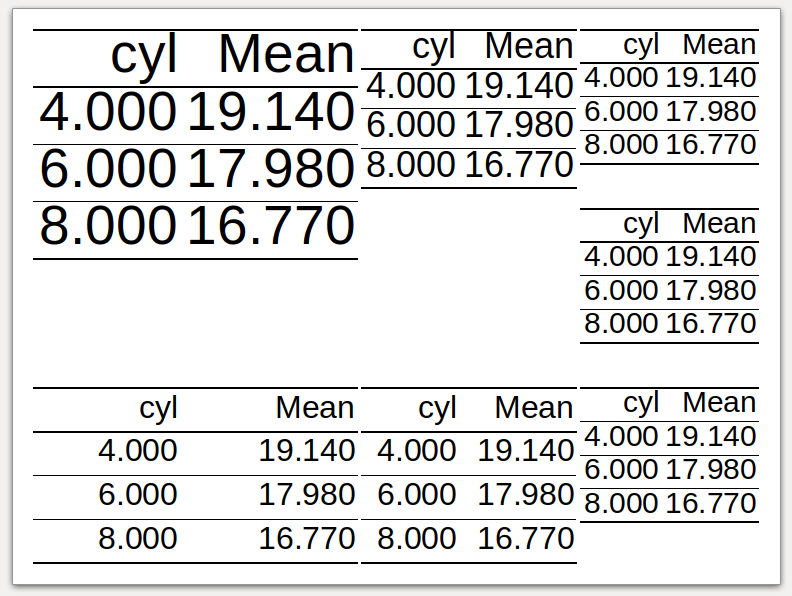
Fit the table to the placeholder - part II
The example below shows the appearance of the table in each placeholder of the layout. It seems that it works reasonably well.
pptx <- read_pptx() %>%
  add_slide(
    master = "Office Theme",
    layout = "Title and Content")

lapply(seq_len(length(offLayout)), function(i) {
  tbl <- phl_adjust_table(table, offLayout, i)
  phl_with_flextable(pptx, olay = offLayout, i, tbl)
  invisible()
})