Create custom layout.
lay_new(mat, widths = NULL, heights = NULL)

layCreate(mat, widths = NULL, heights = NULL)
Arguments
| mat | a matrix specifying the location of the figures. See |
|---|---|
| widths | a vector of values for the relative heights of rows in mat. |
| heights | a vector of values for the relative heights of rows in mat. |
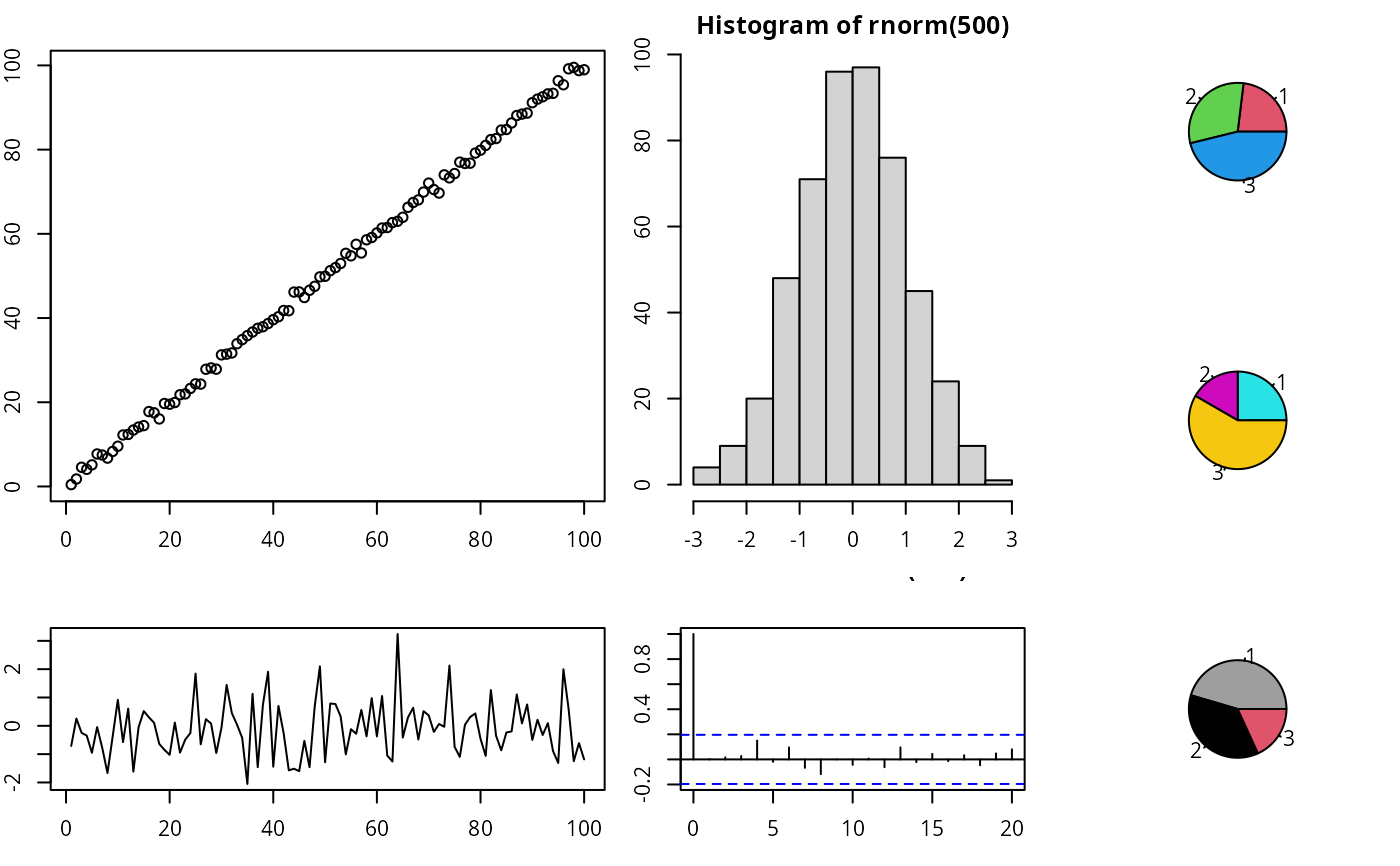
Examples
library(customLayout)
set.seed(123)
par(mar = c(3, 2, 2, 1))

# Prepare layout
lay  <- lay_new(matrix(1:4, nc = 2),
                widths = c(3, 2),
                heights = c(2, 1))
lay2 <- lay_new(matrix(1:3))
cl <- lay_bind_col(lay, lay2, widths = c(3, 1))
lay_set(cl) # initialize drawing area

# add plots
plot(1:100 + rnorm(100))
plot(rnorm(100), type = "l")
hist(rnorm(500))
acf(rnorm(100))
pie(c(3, 4, 6), col = 2:4)
pie(c(3, 2, 7), col = 2:4 + 3)
pie(c(5, 4, 2), col = 2:4 + 6)